The Transformation
How to Connect Disconnected Business Systems
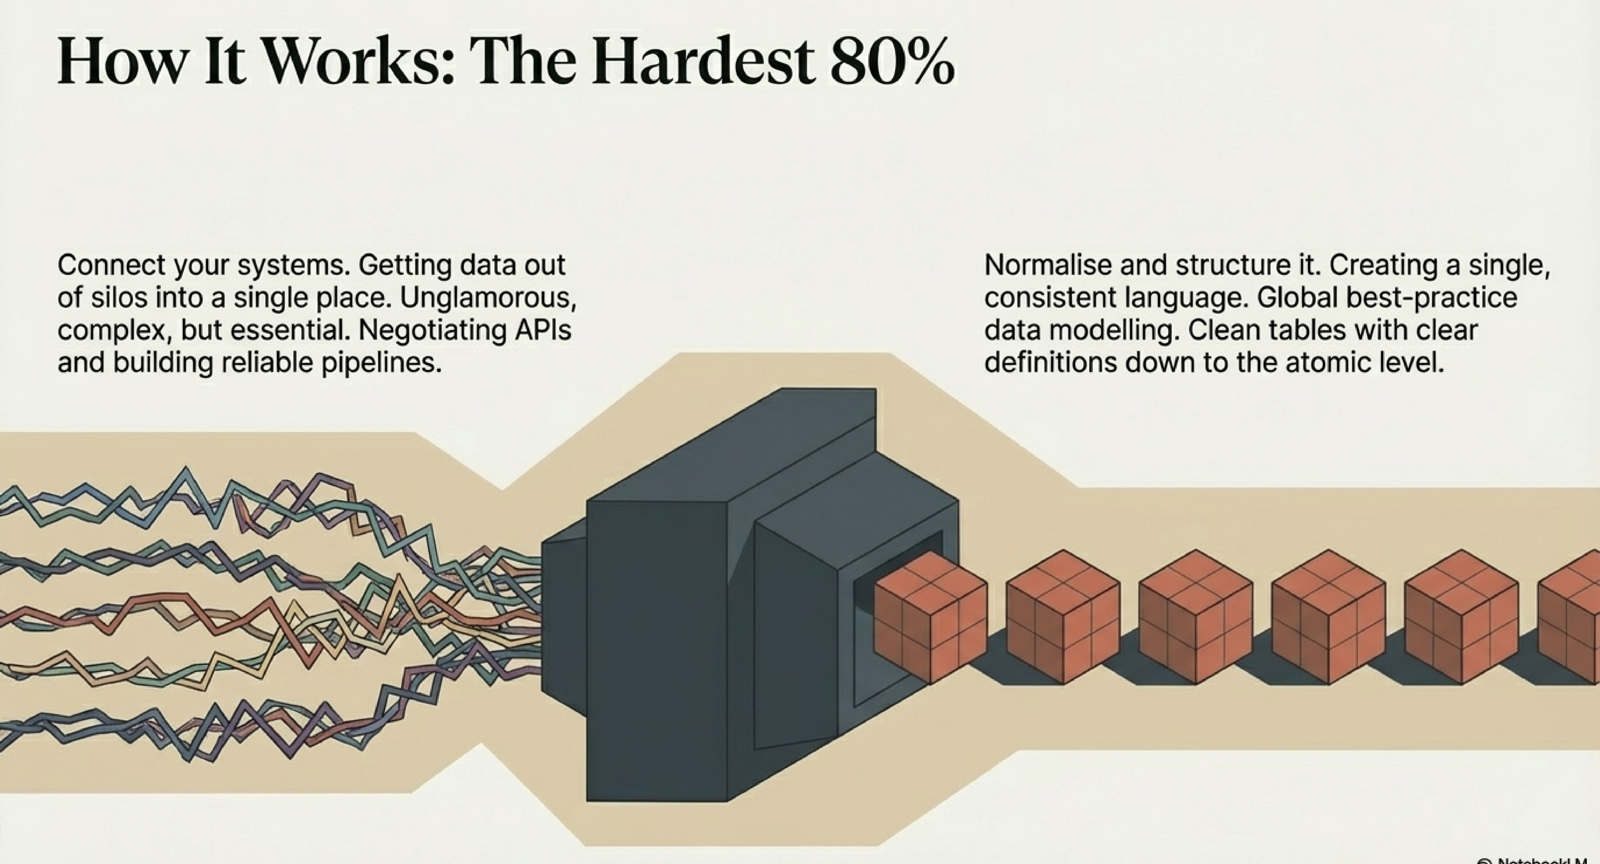
Getting data out of silos and into a single place. Unglamorous, complex, but essential.
The average growing business operates on somewhere between 5 and 20 different software systems. A CRM for sales. An accounting platform for finance. An operations tool, maybe two. A marketing automation platform. A project management system. A payroll system. Each one generates data. None of them were designed to share it.
Why This Is the Hardest 80%
System integration is the unglamorous foundation of every successful data project. It involves negotiating APIs that are often poorly documented, building extraction pipelines that need to handle rate limits and downtime, transforming data formats that were never meant to be compatible, and doing all of this reliably — not once, but every day, automatically. IBM estimates poor data quality costs the US economy $3.1 trillion per year1 — and disconnected systems are a primary driver. This is not the kind of work that makes it into vendor presentations. But it is the work that determines whether everything built on top actually functions.
$3.1T
Annual cost of poor data quality to the US economy
IBM, 2016
The hardest 80% of any data transformation is not analytics or AI. It is connecting the systems and normalising the data.
The Practical Steps
Step one: audit your systems. Map every platform that holds business-critical data. Understand what data lives where, how it is structured, and what APIs or export mechanisms are available. Step two: prioritise. You do not need to connect everything at once. Start with the systems that drive your core commercial decisions — typically your CRM, accounting platform, and primary operational system.
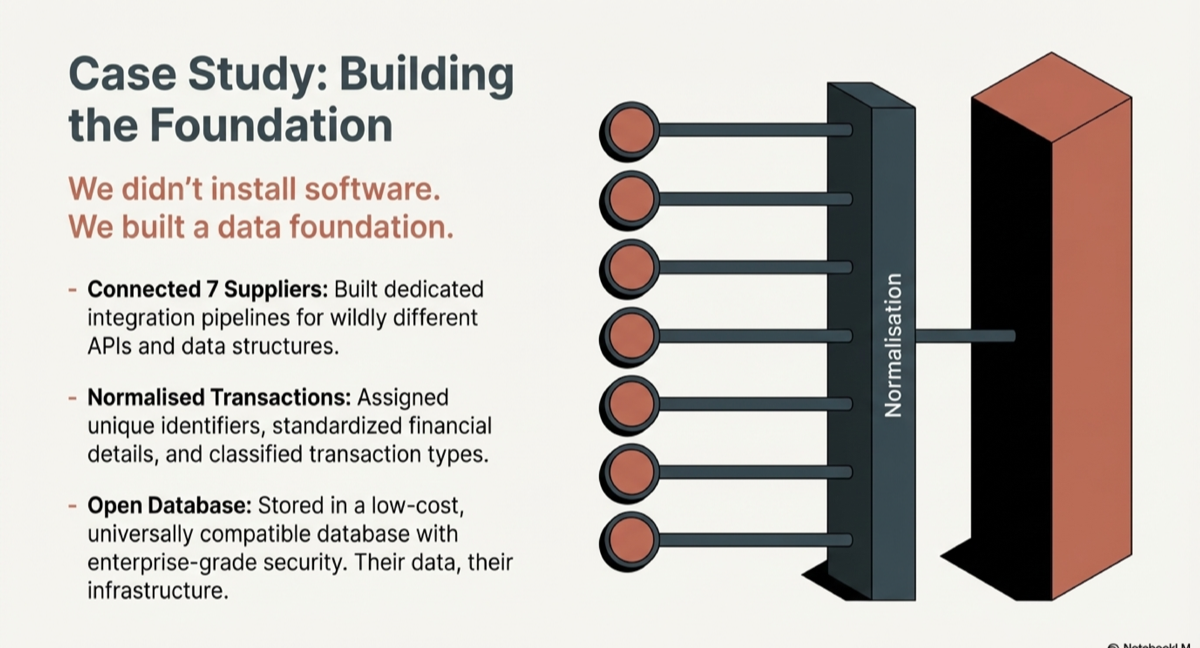
Step three: build extraction pipelines. For each system, build a reliable, automated pipeline that pulls data on a schedule. This needs to handle failures gracefully, log every run, and alert when something breaks. Step four: normalise. Raw data from different systems uses different formats, different naming conventions, different definitions. Normalisation is the process of creating a single, consistent language — assigning unique identifiers, standardising financial details, classifying transaction types, and resolving duplicates.
Common Pitfalls
The most common mistake is trying to do this inside a BI tool. BI tools are designed to visualise data, not to integrate and normalise it. Trying to use them as an integration layer creates a fragile, unmaintainable architecture that breaks every time a source system changes. Gartner predicts that 80% of organisations seeking to scale digital business will fail because they lack a modern approach to data governance2. The second mistake is underestimating the normalisation work. Getting data out of silos is step one. Making it consistent and reliable is where the real value is created — and where most DIY attempts fail.
The Result
When your systems are connected and your data is normalised, you have a single, reliable data layer that can power anything. Dashboards that refresh automatically. Reports that assemble in seconds. Forecasting models that train on clean historical data. AI capabilities that actually work because they have structured data to work with. Every capability you want to build in the future becomes faster, cheaper, and more reliable because the foundation is in place.
Sources
- IBM, "The Four V's of Big Data" / Thomas C. Redman analysis (2016)
- Gartner, "Data and Analytics Governance" (2022)
Related Capabilities
Infrastructure & Database Modernisation
Legacy systems and fragmented databases slow everything down. We modernise your data infrastructure — warehousing, pipelines, and platforms — to eliminate silos, reduce cost, and establish the single source of truth your organisation can scale on.
Data Strategy & Architecture
Before any technology investment, the architecture and governance must be right. We define data strategy aligned to commercial objectives — the roadmap, standards, and operating model that turn raw data into a durable competitive asset.
Continue Reading
The Foundation
What Is a Data Foundation (And Why It Matters)
A data foundation is the structured, connected data layer that powers every reliable decision, dashboard, and AI capability in your business. Learn what it is and why it is the most important investment you can make.
Read →The Outcome
From Spreadsheets to Real-Time Dashboards
The journey from manual spreadsheet reporting to automated, real-time dashboards. What it takes, what it costs, and why the foundation matters more than the tool.
Read →The Transformation
AI Readiness Starts With Clean Data
AI is just hype without structured data. Learn why clean data is the prerequisite for any meaningful AI capability, and what AI readiness actually looks like for growing businesses.
Read →Ready to build your data foundation?
Let's have a conversation about where you are and whether data foundations are the right investment right now.
Start a Conversation